
Graphing and Writing Linear Functions SOLVING EQUATIONS INVOLVING RATIONAL EXPONENTS Linear Equations and Graphing Systems of Linear Equations Solving Polynomial Equations Matrix Equations and Solving Systems of Linear Equations Introduction Part II and Solving Equations Linear Algebra Graphing Linear Inequalities Using Augmented Matrices to Solve Systems of Linear Equations Solving Linear Inequalities Solution of the Equations Linear Equations Annotated Bibliography of Linear Algebra Books Write Linear Equations in Standard Form Graphing Linear Inequalities Introduction to Linear Algebra for Engineers Solving Quadratic Equations THE HISTORY OF SOLVING QUADRATIC EQUATIONS Systems of Linear Equations Review for First Order Differential Equations Systems of Nonlinear Equations & their solutions LINEAR LEAST SQUARES FIT MAPPING METHOD FOR INFORMATION RETRIEVAL FROM NATURAL LANGUAGE TEXTS Quadratic Equations Syllabus for Differential Equations and Linear Alg Linear Equations and Matrices Solving Linear Equations Slope-intercept form of the equation Linear Equations DETAILED SOLUTIONS AND CONCEPTS QUADRATIC EQUATIONS Linear Equation Problems Systems of Differential Equations Linear Algebra Syllabus Quadratic Equations and Problem Solving LinearEquations The Slope-Intercept Form of the Equation Final Exam for Matrices and Linear Equations Linear Equations |
Graphing Linear InequalitiesLike linear equations, linear inequalities start by
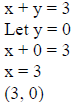
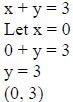
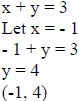
graphing as a line. Unlike linear equalities this Example 1: Graph x + y > 3 .
Since the problem states that the equation is greater than
but not equal to three,
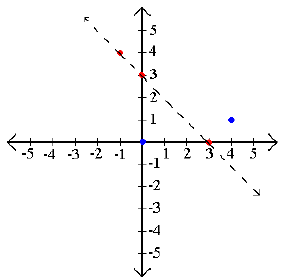
Now we graph the line for x + y = 3 and our two test
points. Remember to use a
Step 3: Shade the true areas
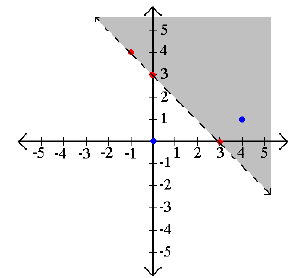
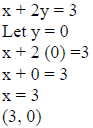
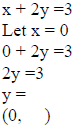
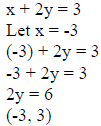
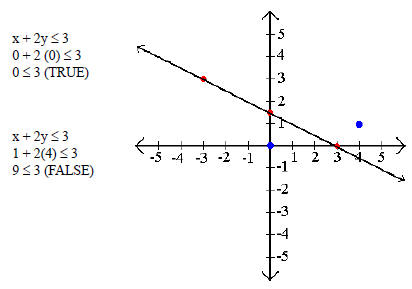
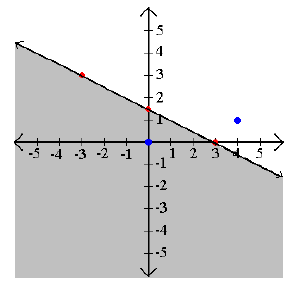
Example 2: Graph x + 2y ≤ 3.
Step 2: Test points on both sides of the barrier.
Step 3: Shade the true areas
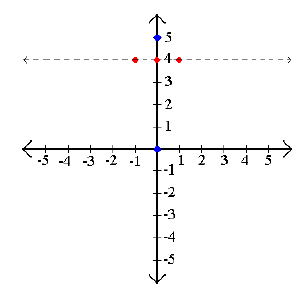
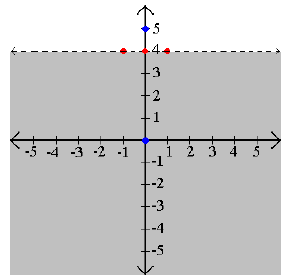
Example 3: Graph y < 4 .
Step 2: Test points on both sides of the barrier.
Step 3: Shade the true areas. Since (0, 0) lies
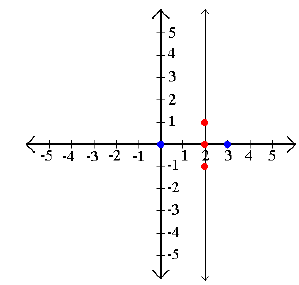
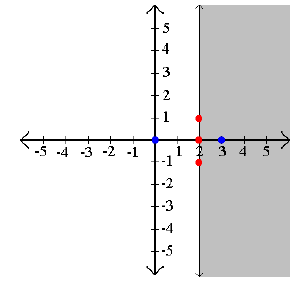
Example 4: Graph x ≥ 2
Step 2: Test points on both sides of the barrier. x ≥ 2
Step 3: Shade the true areas.
|
||||||||||||||||||||||